Funnel architecture · Full-channel measurement · AI automation
Every channel, one funnel.
Every repeat task, automated.
We turn scattered marketing channels and assets into a single measurable funnel, instrumented stage by stage with the KPIs that actually matter — then automate the operations that run on top of it.
Sign in to open a working dashboard built exactly this way.
Today — 40+ channels and assets
After — one measurable funnel
Your funnel lives in a deck. Not in your data.
- The stages are defined — but nothing connects them to the assets that actually move them.
- Every platform defines its own metrics — impressions, views, streams — so nothing adds up per stage.
- Paid gets measured. Organic, owned, earned and community never reach the funnel at all.
If you can't see which stage is stuck, you can't decide what to automate. That's why we measure before we automate.
Services
Architect. Measure. Automate.
In that order. Skip a step and the automation gets built on guesswork.
Funnel architecture
We take the funnel you already have and redefine it in measurable terms — starting from the channels you actually run, fixing the stages, and locking one core KPI per stage. No generic template pushed over your business.
Full-channel measurement
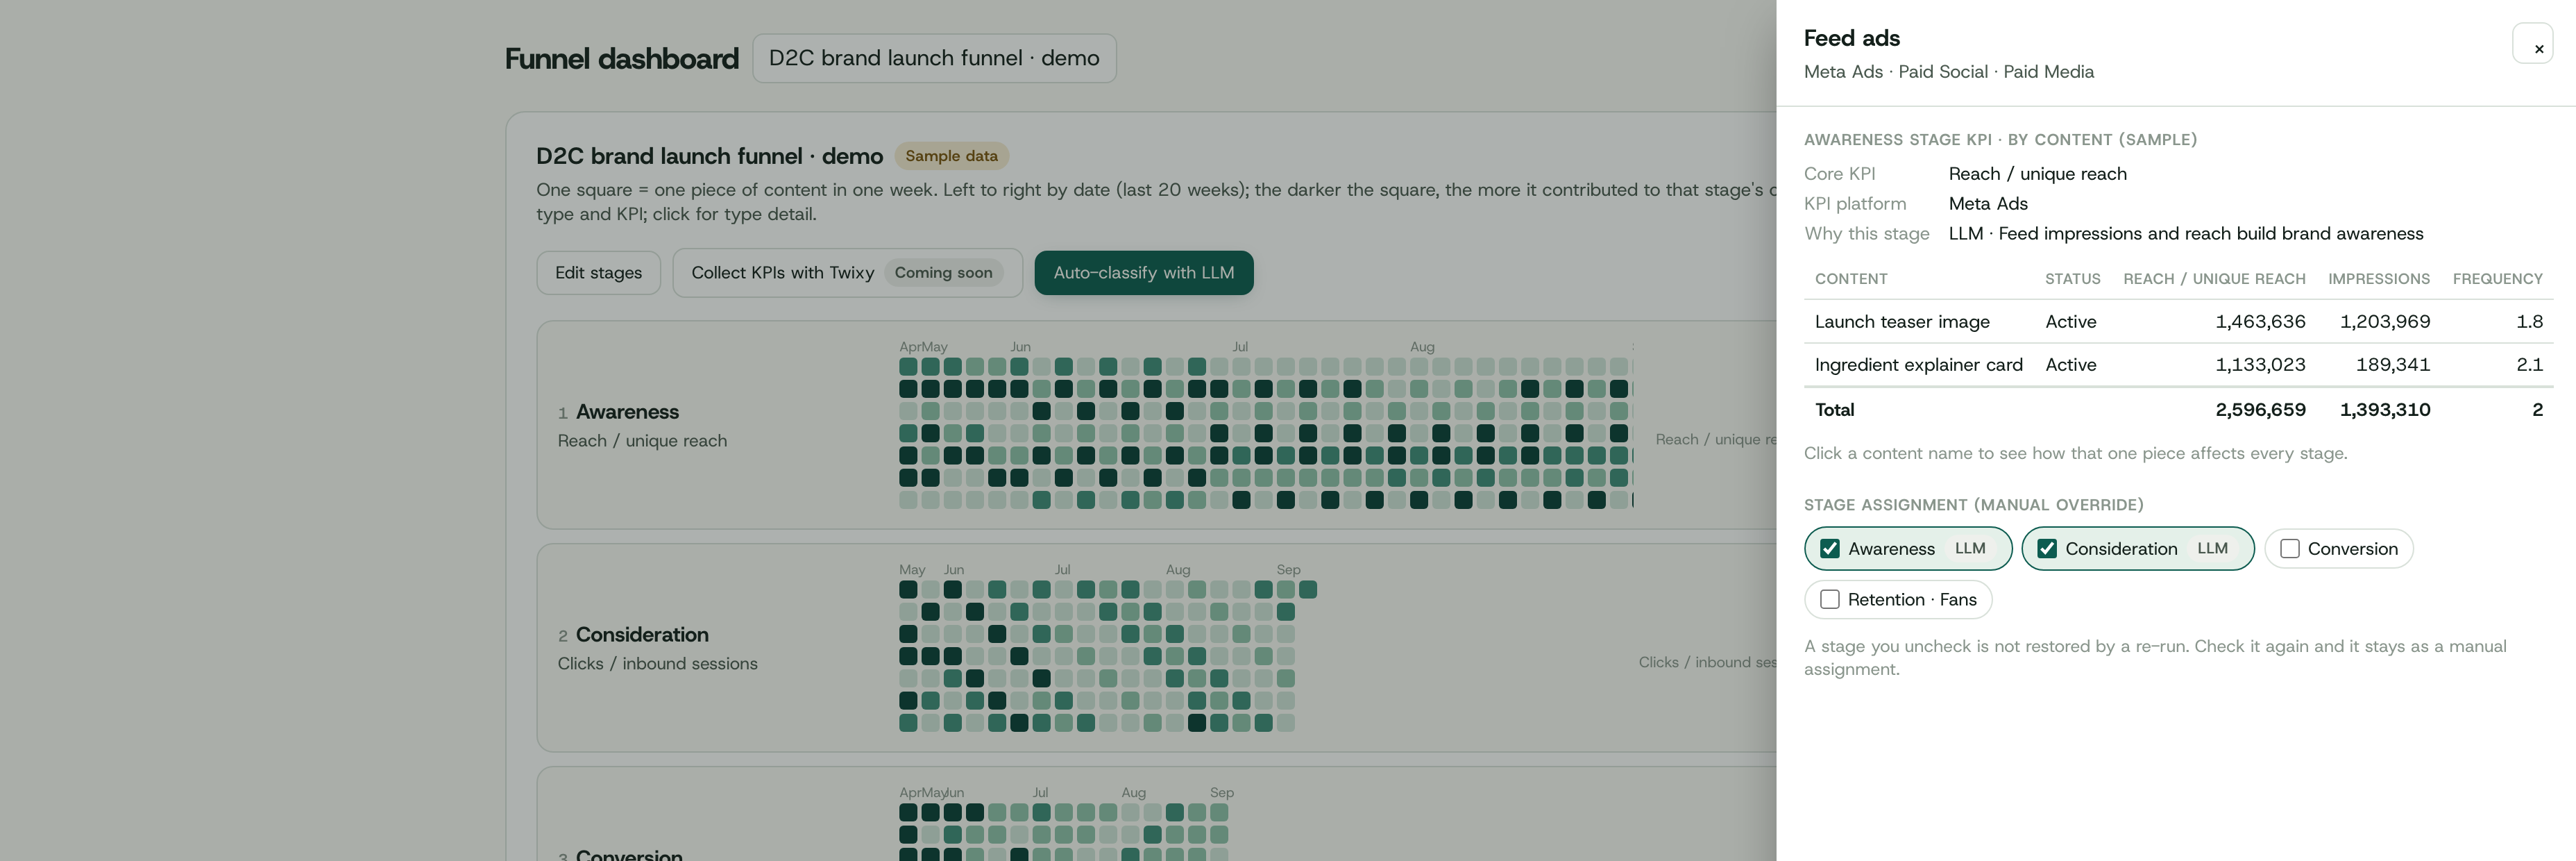
We normalize your channel and asset master across Paid, Organic, Owned, Earned, Partnership and Offline, then map every content type to a funnel stage. AI proposes each mapping with its reasoning; your team approves or overrides it.
Marketing ops automation
Once measurement is in place, the bottlenecks surface. We build custom AI systems for the repeat work sitting on them — competitor and trend research, data collection, recurring reporting, funnel upkeep.
How it works
Measurement first. Automation second.
What Phase 1 measures is what decides Phase 2's scope.
Architect & measure
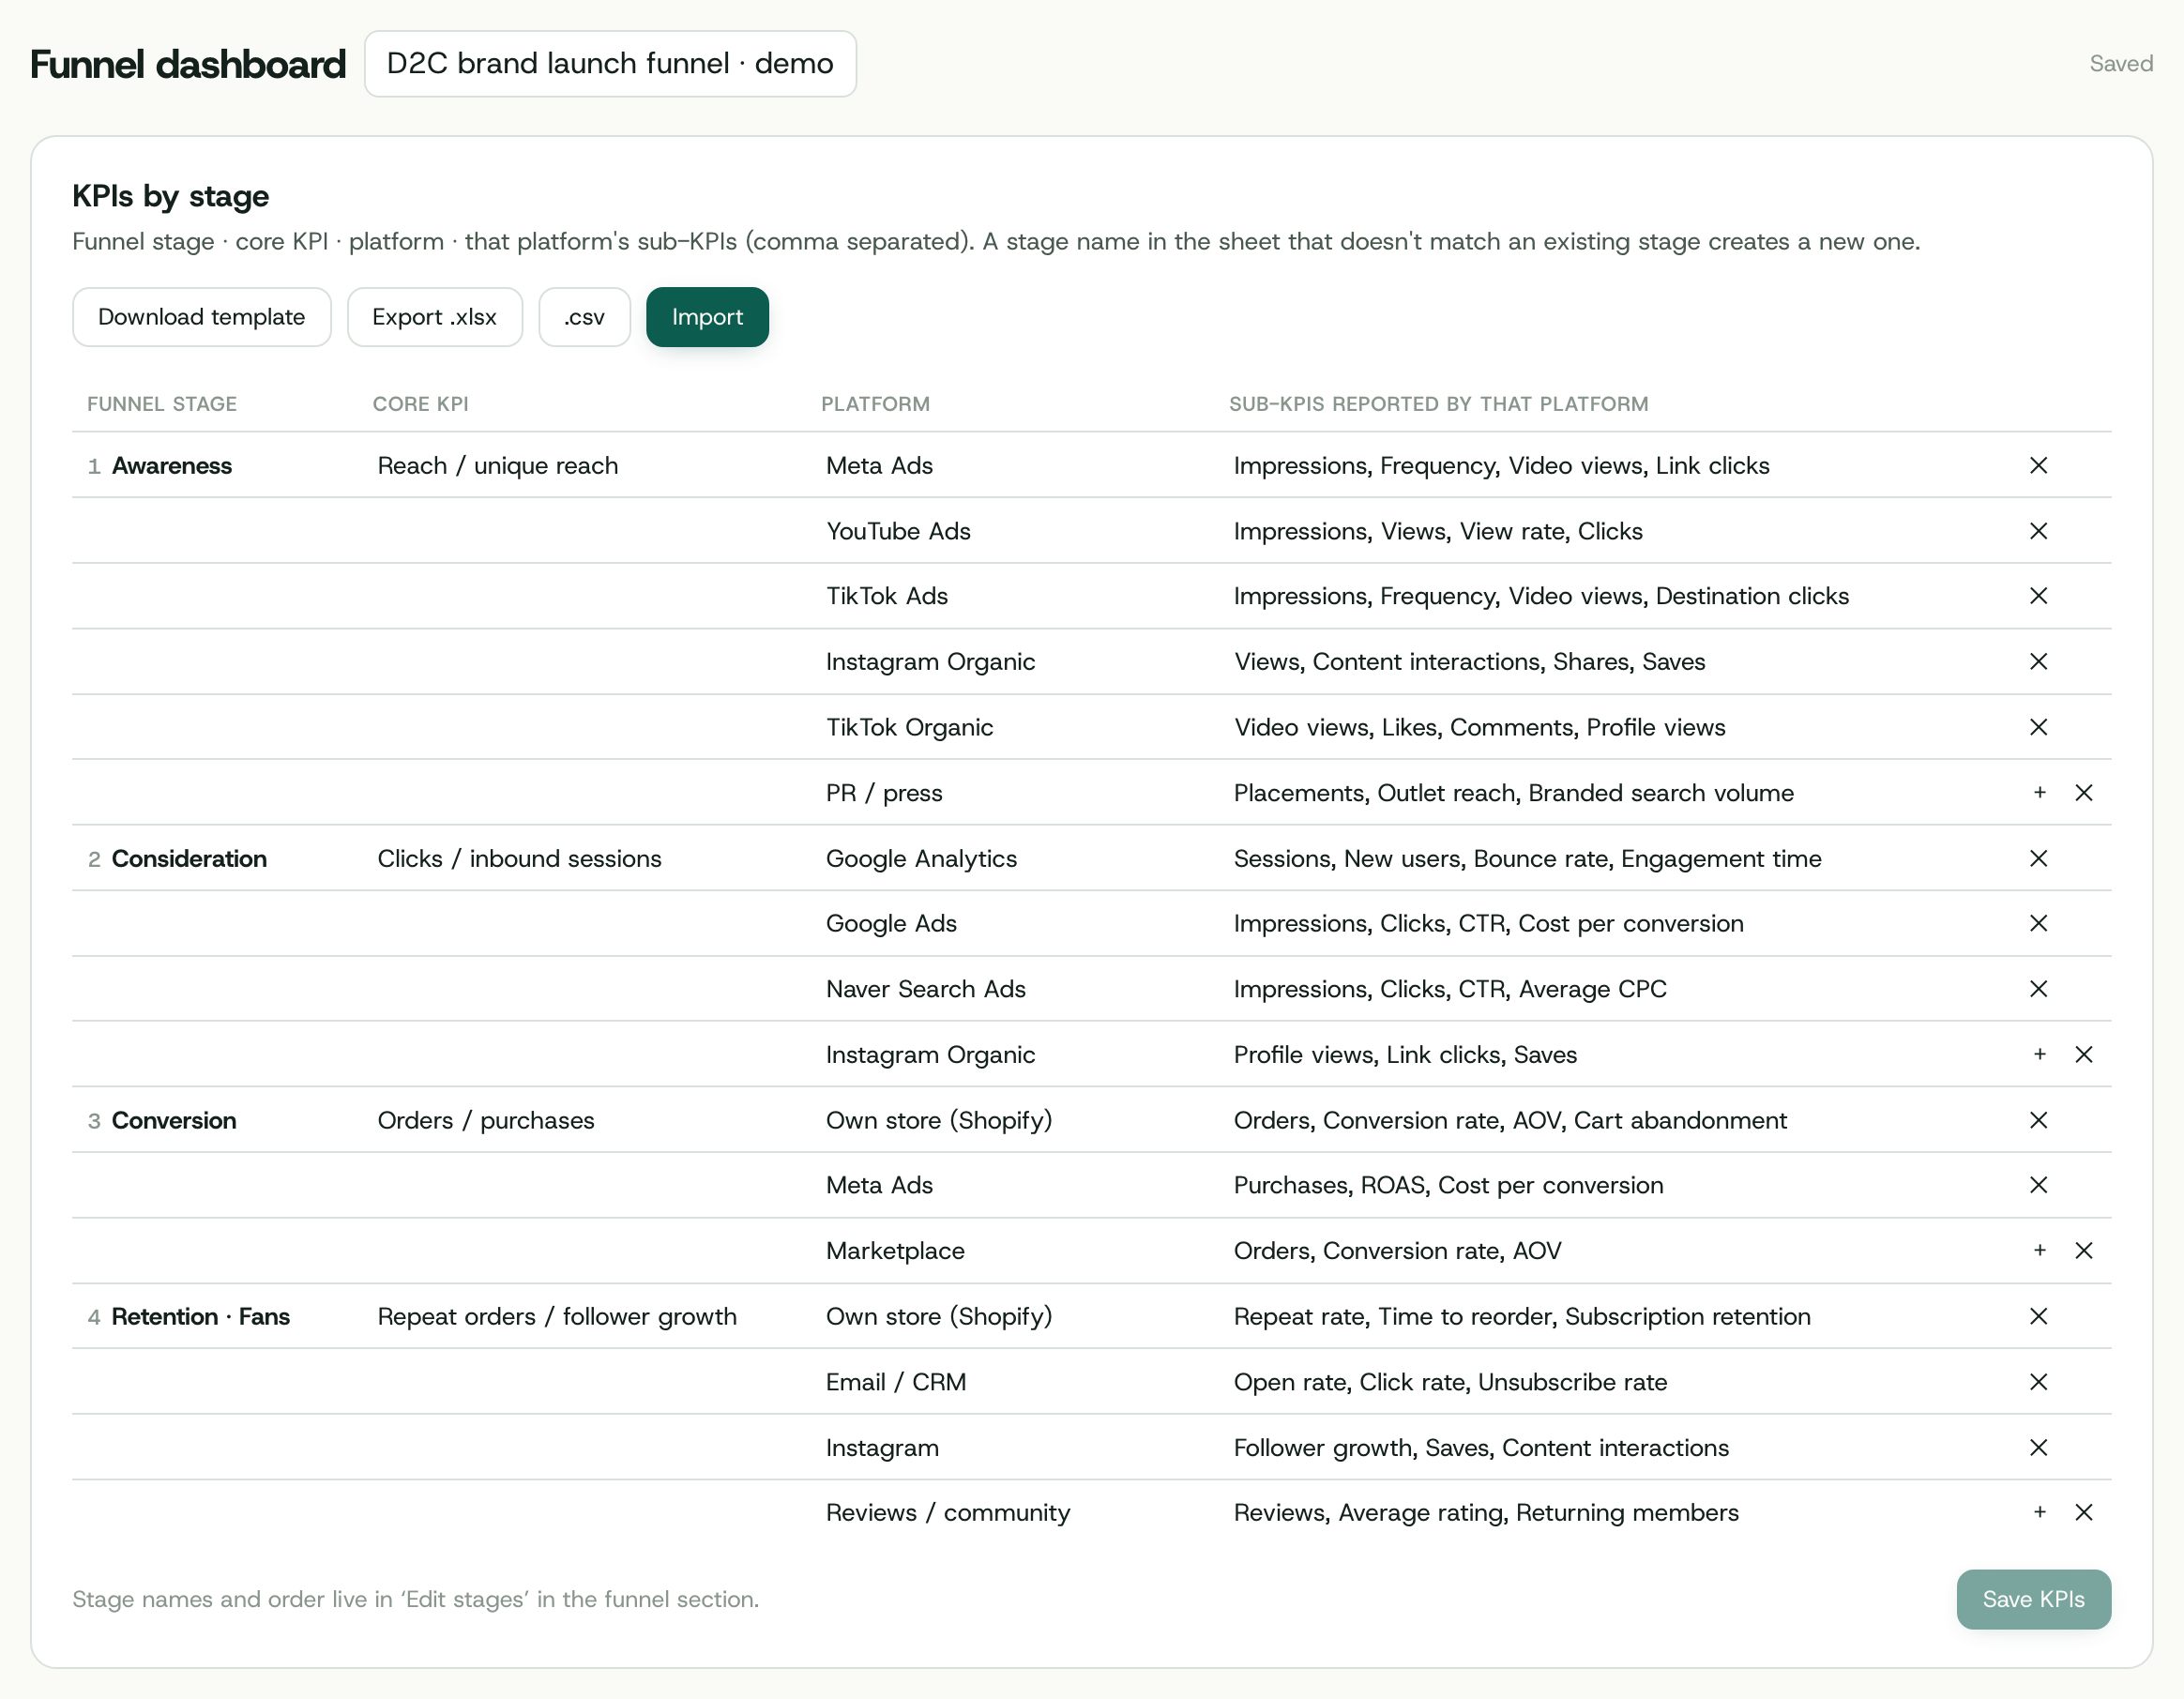
- 1Collect the channel and asset inventory — scattered sheets normalized into one master.
- 2Define funnel stages and the core KPI for each — fitted to how the brand actually operates.
- 3Map content types to stages — AI proposes with reasoning, your team approves or overrides.
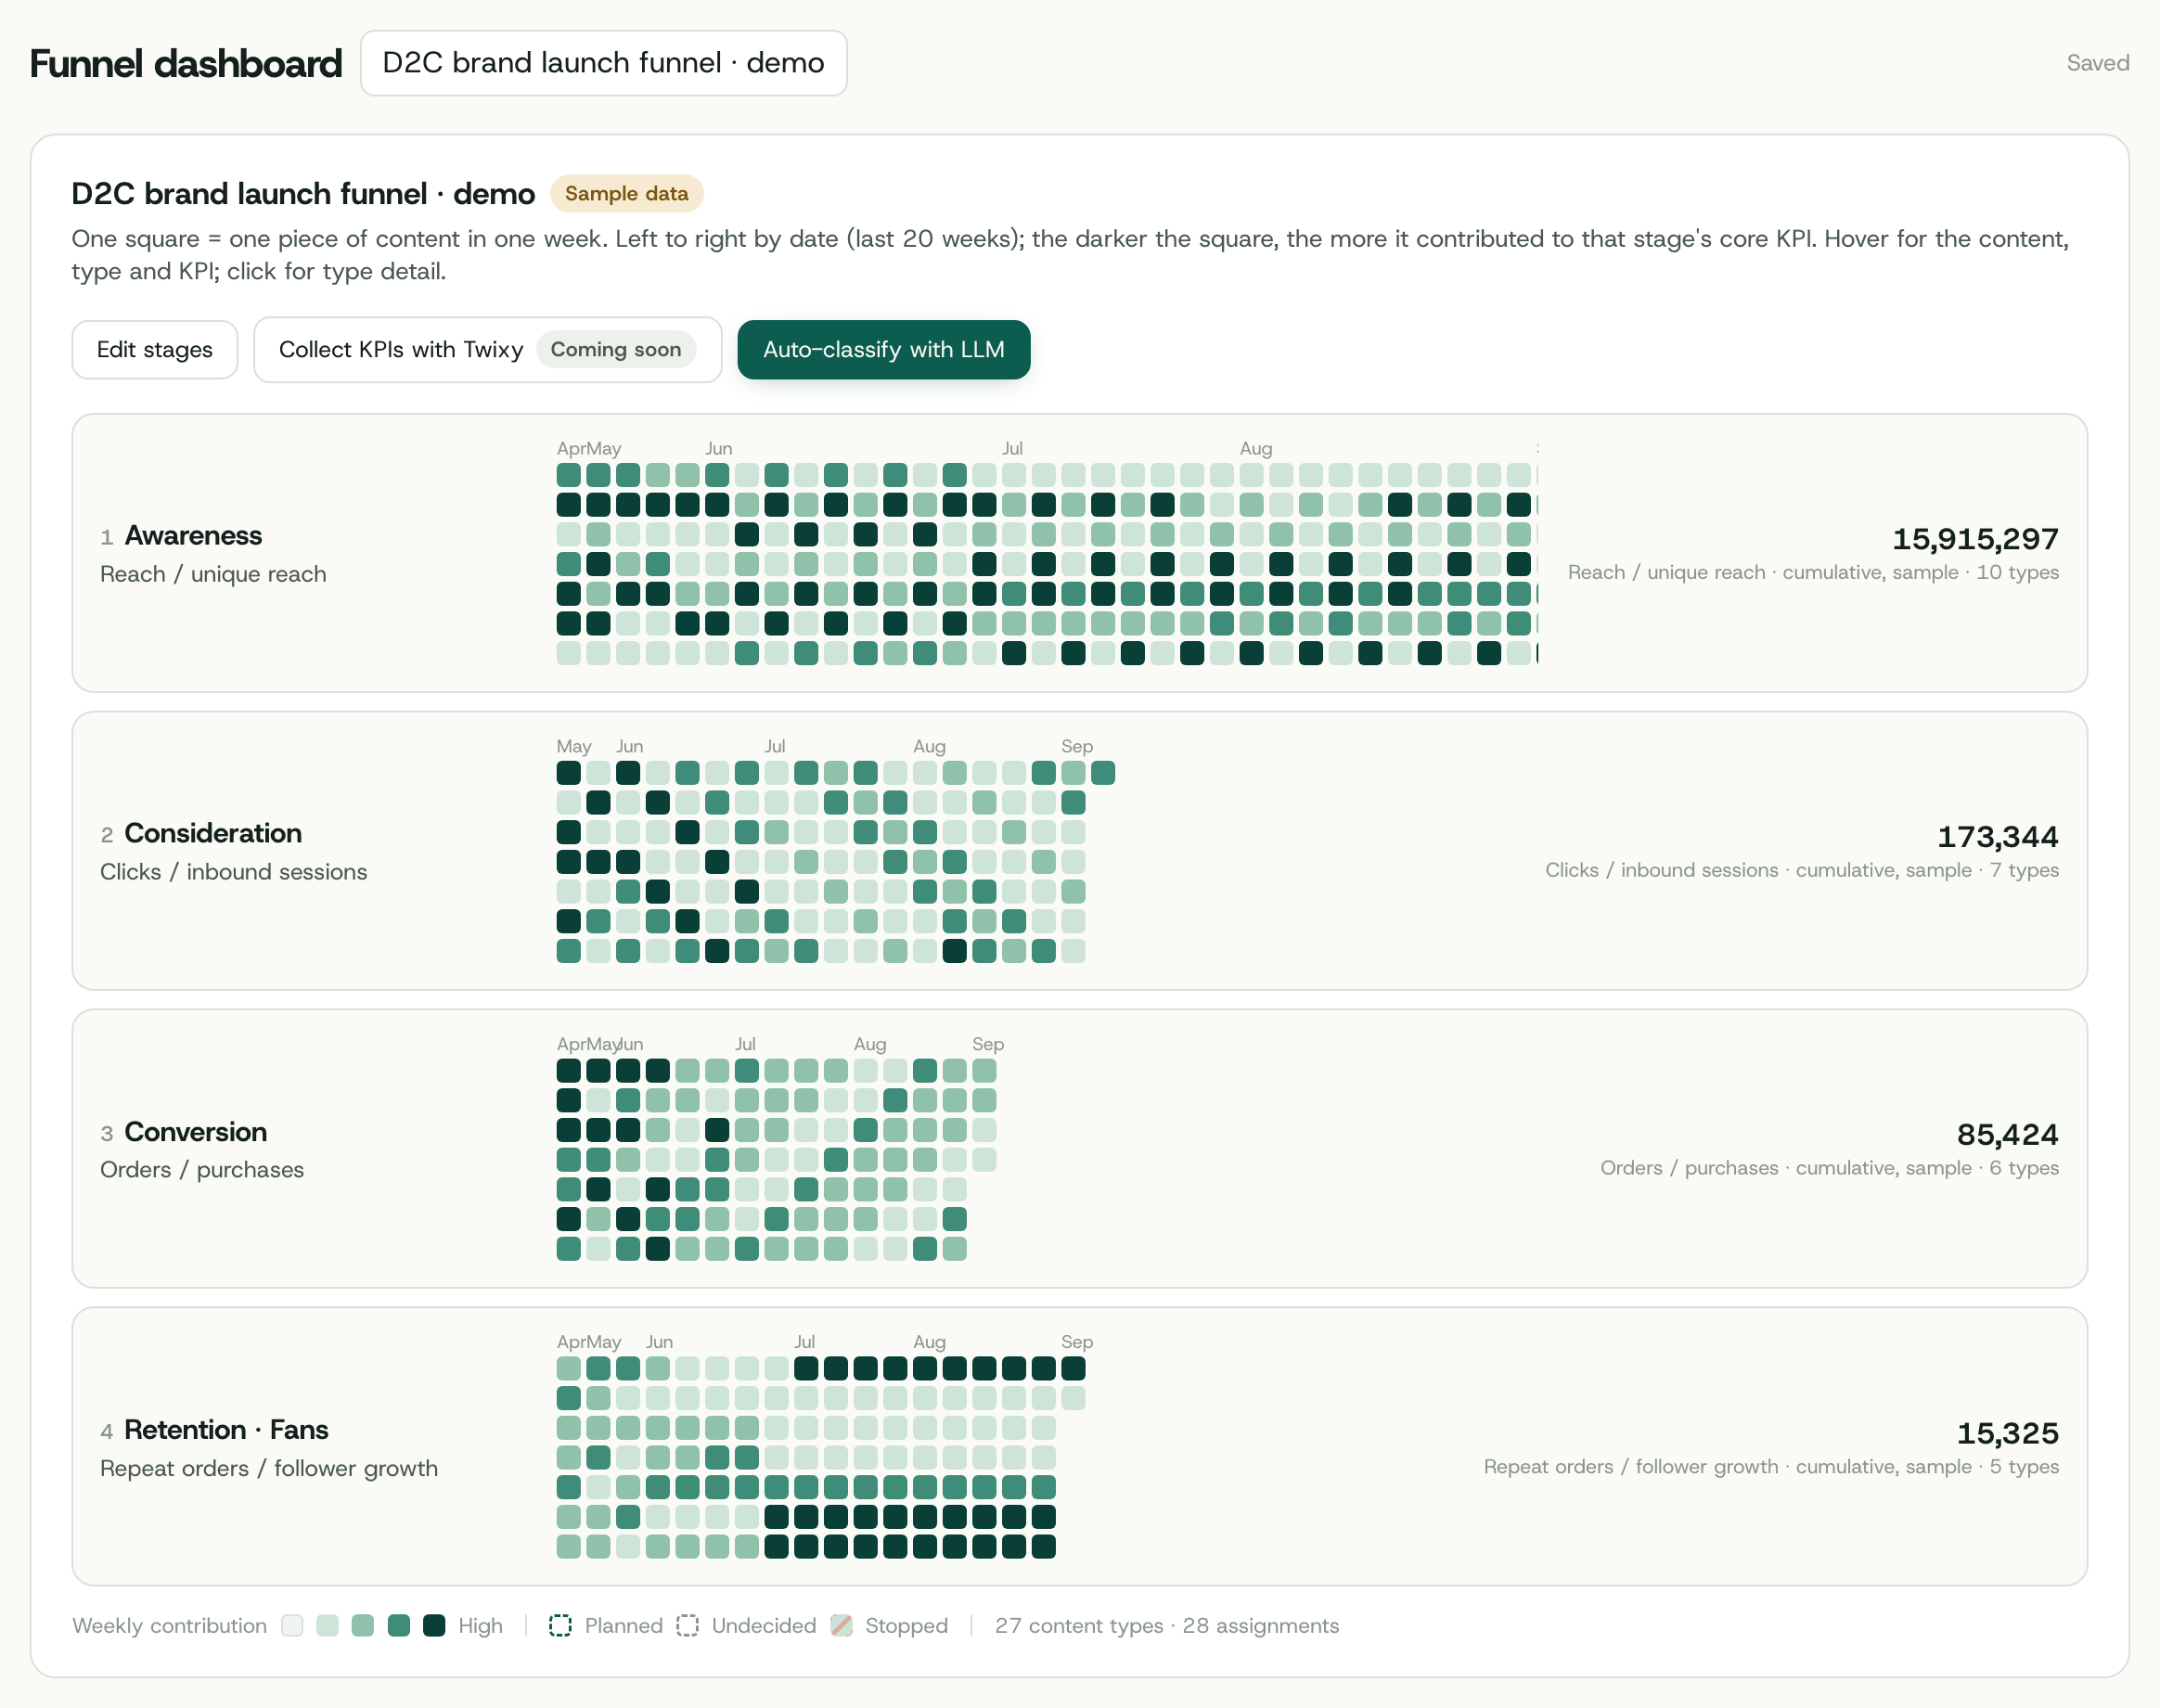
- 4Dashboard goes live — every channel tracked against the funnel in one place.
Automate
- 1Identify the bottleneck from real data — which stage is actually stuck.
- 2Build the custom AI system for the repeat work sitting on that stage.
- 3Hand it over in a form your team can run and change without us.
Case · Entertainment / music release
Six channel types, 40+ assets — connected into one funnel.
Starting point
The brand was already running six channel types at once — paid media, organic social, music platforms, PR, fan community and offline. With that much in flight, every channel reported on its own terms, so what it needed was a single basis to add them up.
What we built
One master inventory, four funnel stages with a core KPI each, and every content type mapped onto the stage it actually moves. All six channel types now roll up into one dashboard on the same basis.
What came next
With the funnel measurable, the team could see which stage would repay the next push — and the repeat work sitting on it became the automation scope. That is section 6.
After onboarding
Measurement is where we start. Not where we stop.
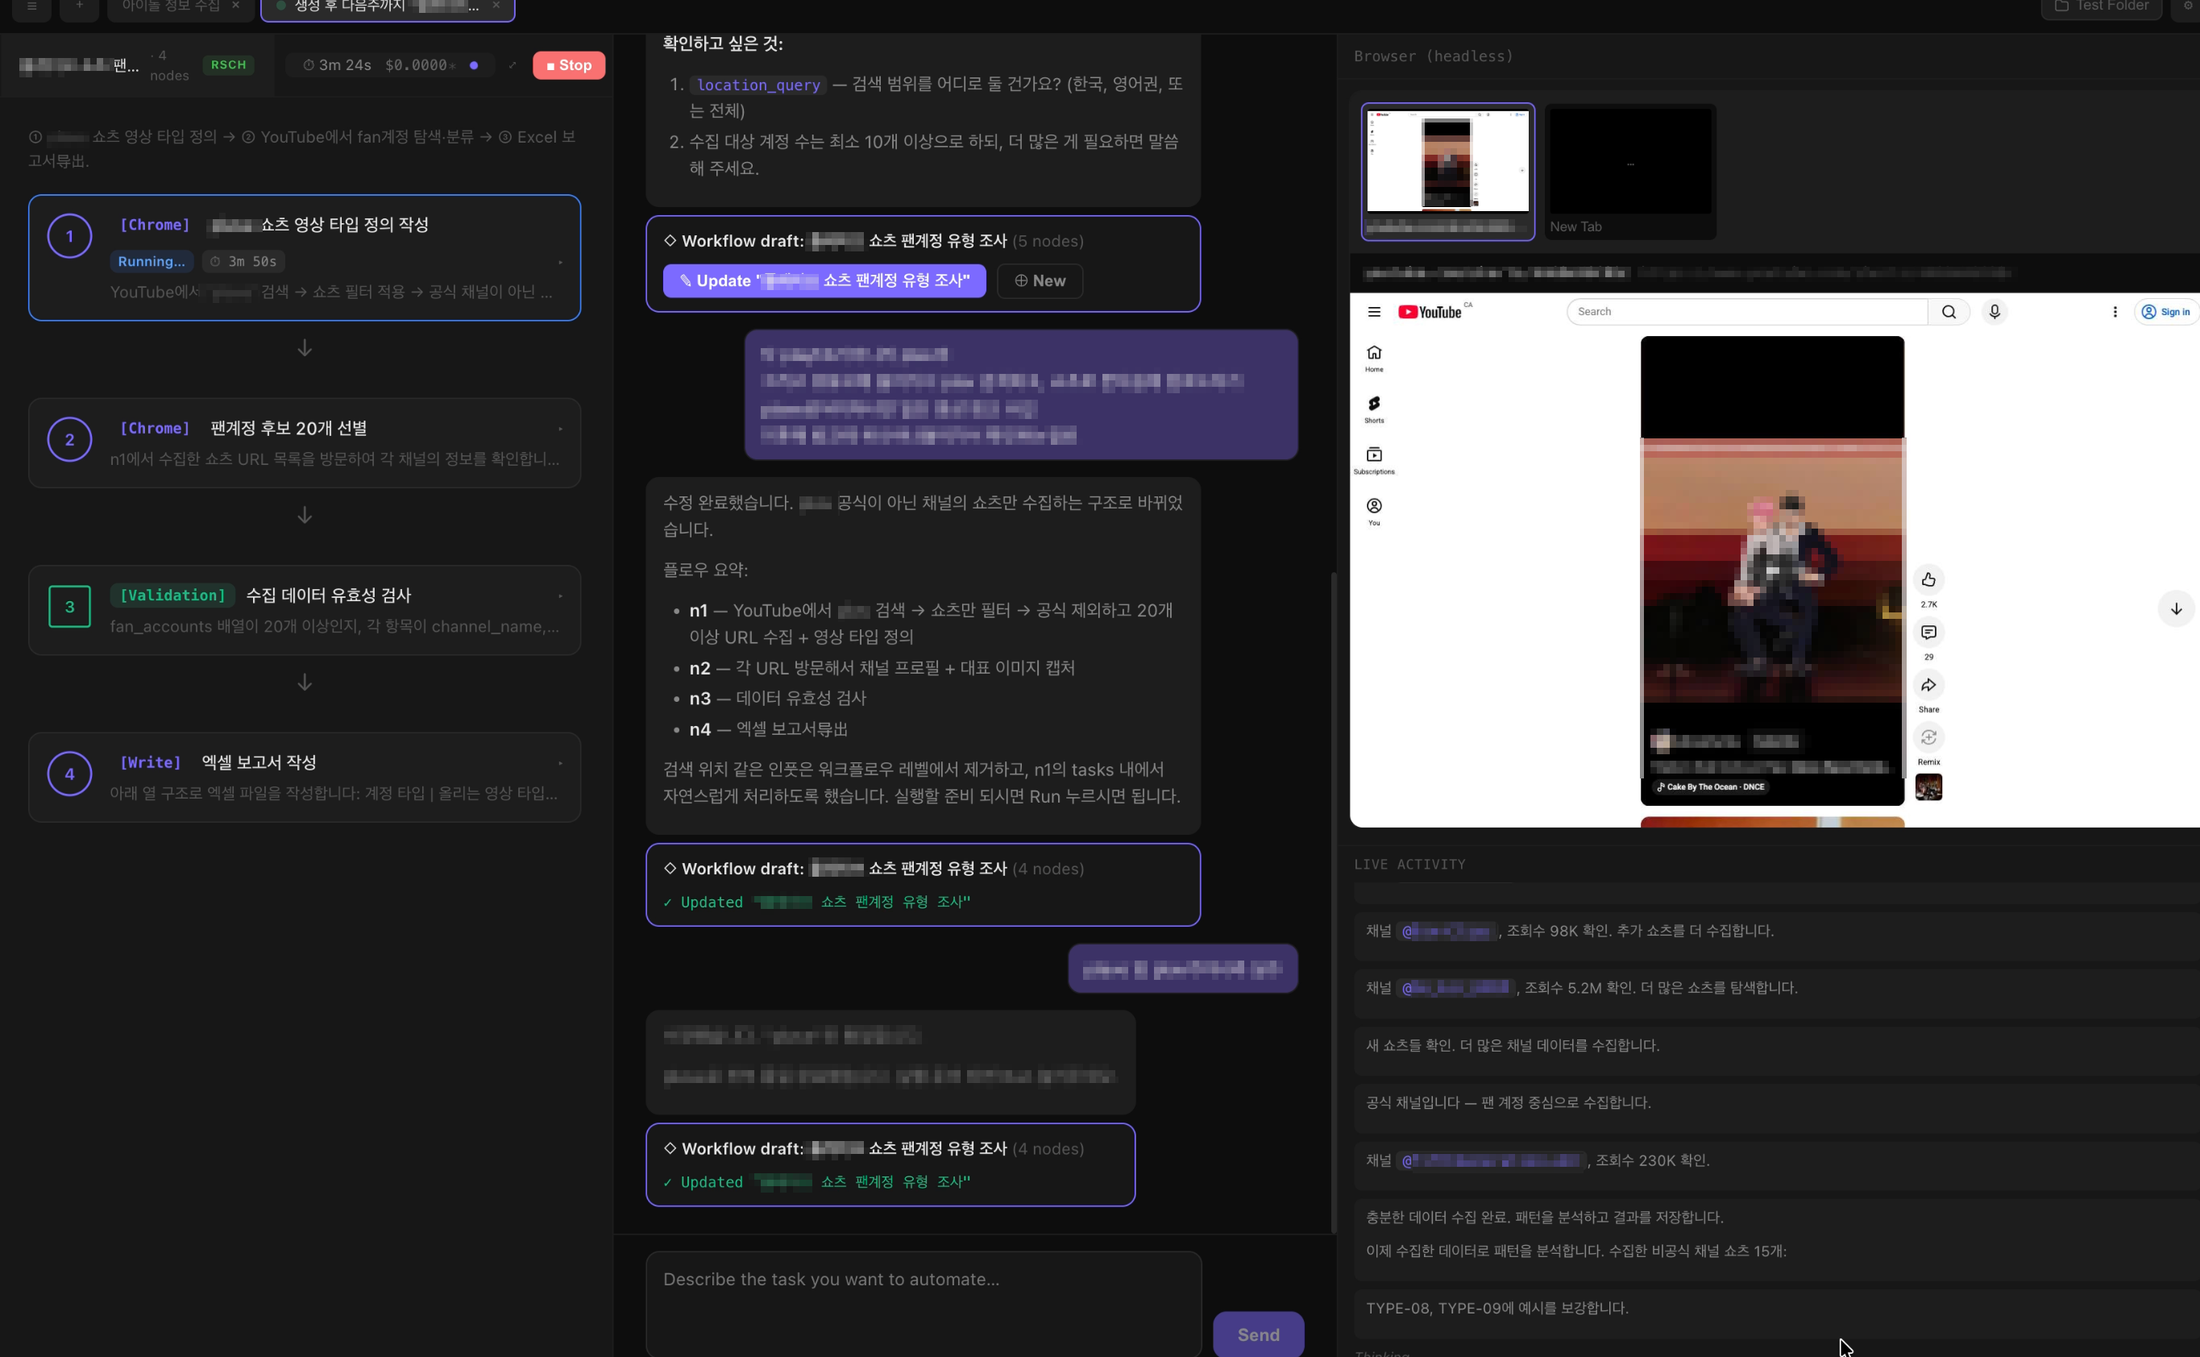
Once the funnel is instrumented, the repeat work around it is what we automate — running in a real browser, on your logins, producing the files your team already uses.
Browser research
Competitor tracking, trend and format scans, account discovery — driven in a real Chrome, so logged-in pages and sources without an API are still reachable.
Sheet · Markdown brief
Data collection
Multi-site scraping and field normalization, merged into one sheet on a schedule instead of by hand each week.
Excel · Google Sheets
Reports & decks
The recurring weekly or monthly report assembled from the funnel data — same structure, new numbers, no re-typing.
PPTX · PDF · Docs
Email & routing
Drafts and sends built off what the run found — the client update, the internal digest, the alert when a KPI moves.
Draft · Send · Alert
Each one is scoped from what the dashboard showed was actually stuck — never a template menu.
Right now we work deeply with one brand.
Which means the next one gets the same density. Whether we start from funnel architecture or add automation on top of metrics you already have is what the first conversation decides.
Talk to usThe desktop program your team runs the finished systems in: See the program →